prometheus + Grafana监控ShellCrash流量
记录使用项目 clash-exporter 搭建ShellCrash流量监控平台的流程,部署时博主的shellcrash使用的clash meta核v1.18.5
安装clash-exporter
项目release中下载对应平台版本的可执行文件,解压至/opt/clash_exporter
1 | cd /opt/clash_exporter |
报错
failed to dial: failed to WebSocket dial: expected handshake response status code 101 but got 404
原因是监听默认127.0.0.1:9090地址,但是ShellCrash运行端口为9999
1 | vim /etc/profile |
再试运行就没报错了
守护进程
设置守护进程需要的环境变量
1 | vim /opt/clash_exporter/env |
添加守护进程
1 | vim /etc/systemd/system/clash_exporter.service |
浏览器打开 http://IP:2112/metrics 确保有输出
安装prometheus
官网 下载对应平台版本,解压至/opt/prometheus
1 | cd /opt/prometheus |
1 | # my global config |
1 | vim first_rules.yml |
1 | groups: |
试运行
1 | ./prometheus |
守护进程
1 | vim /etc/systemd/system/prometheus.service |
1 | [Unit] |
1 | systemctl daemon-reload |
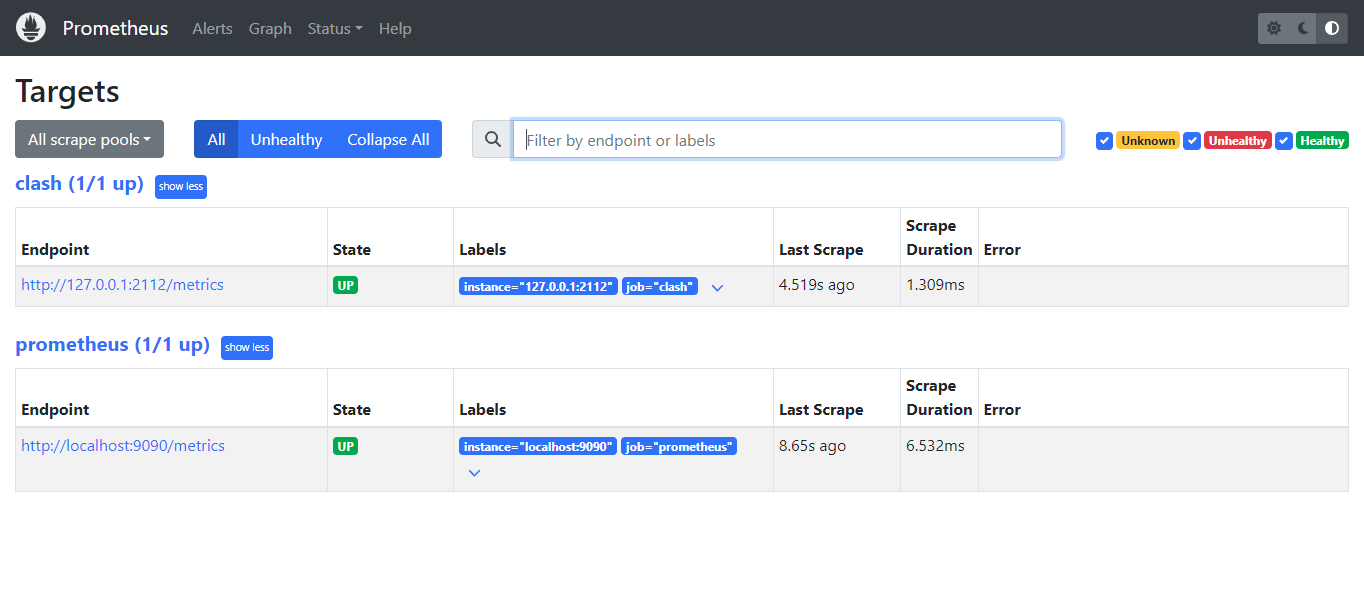
浏览器访问 http://IP:9090 打开 status->Targets 确保clash状态为up
安装Grafana
1 | apt install grafana |
修改Grafana默认端口号
因为Grafana默认端口号为3000,已经被我本机的AdGuardHome占用掉了,所以需要修改一下Grafana端口号为4000
1 | vim /etc/grafana/grafana.ini |
浏览器打开 http://IP:4000
添加数据源
连接->数据源
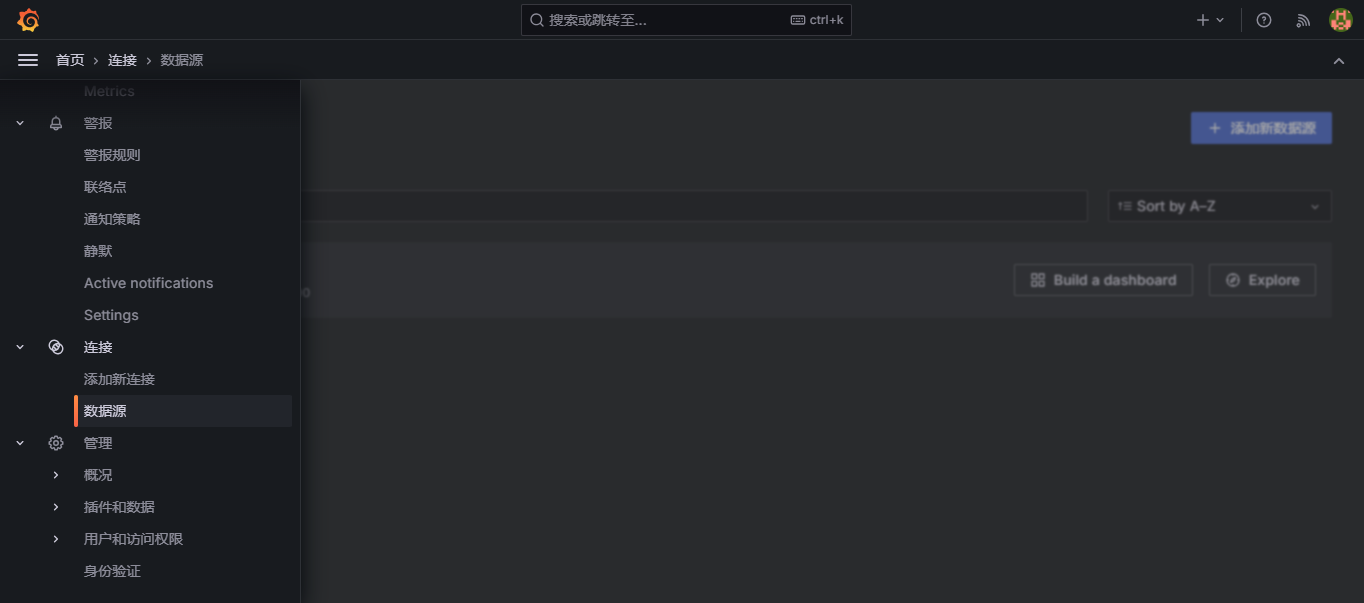
添加数据源->prometheus
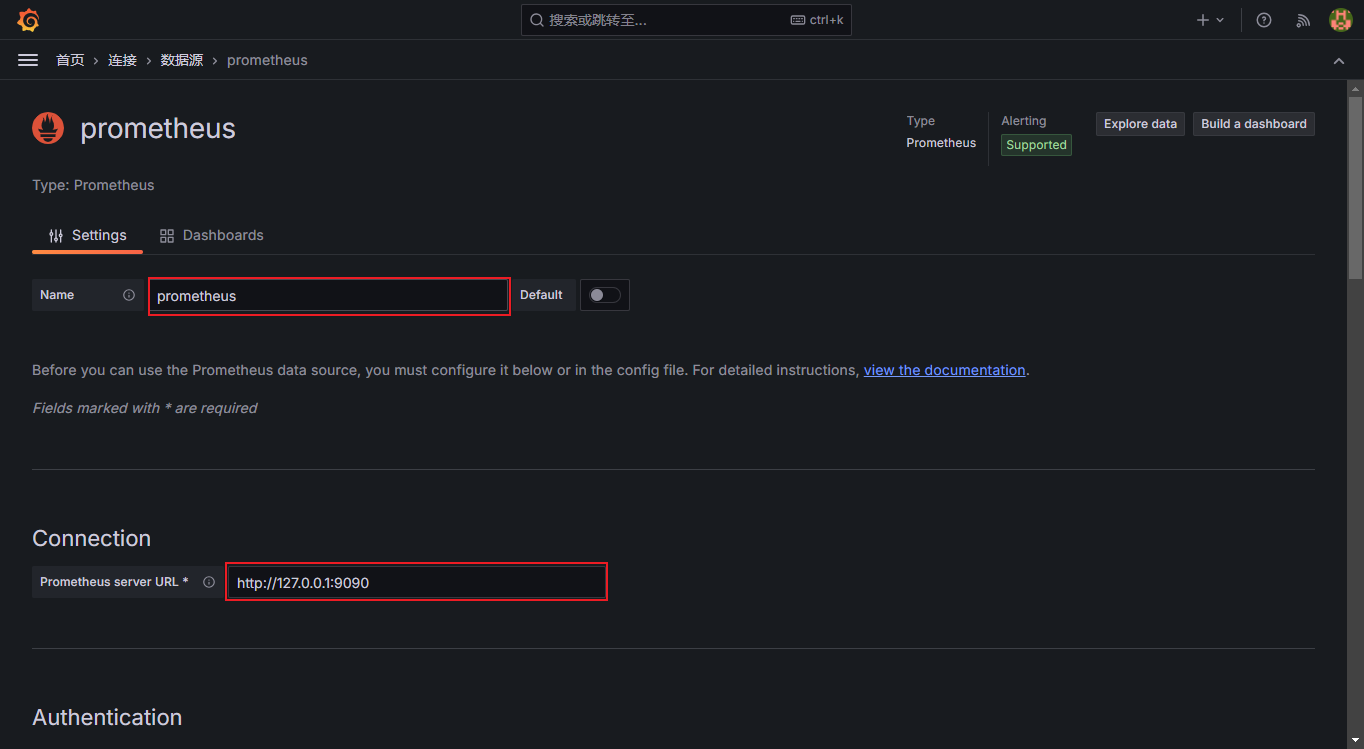
其他地方不用改,Save &test
添加仪表盘
首页->仪表盘->新建->导入
id 18530 加载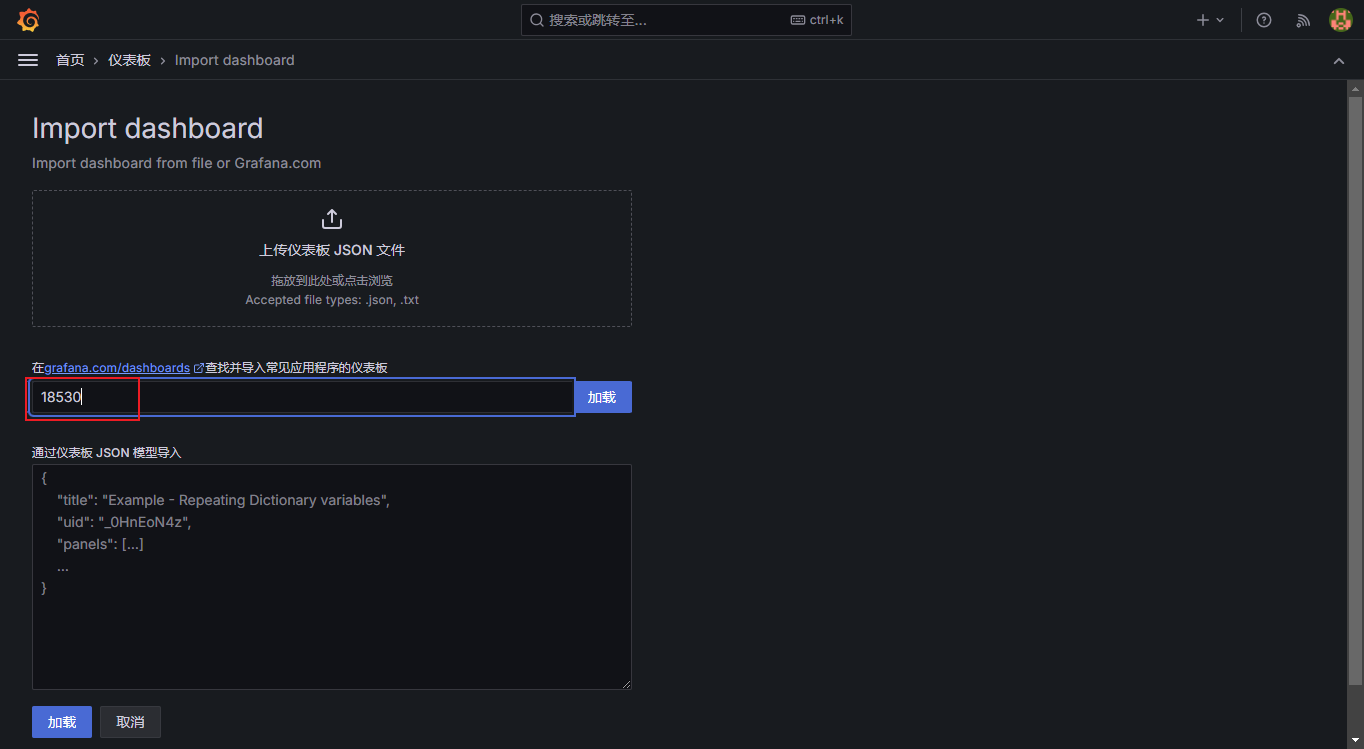
Name随便起
数据源选择刚才添加的prometheus
最终效果
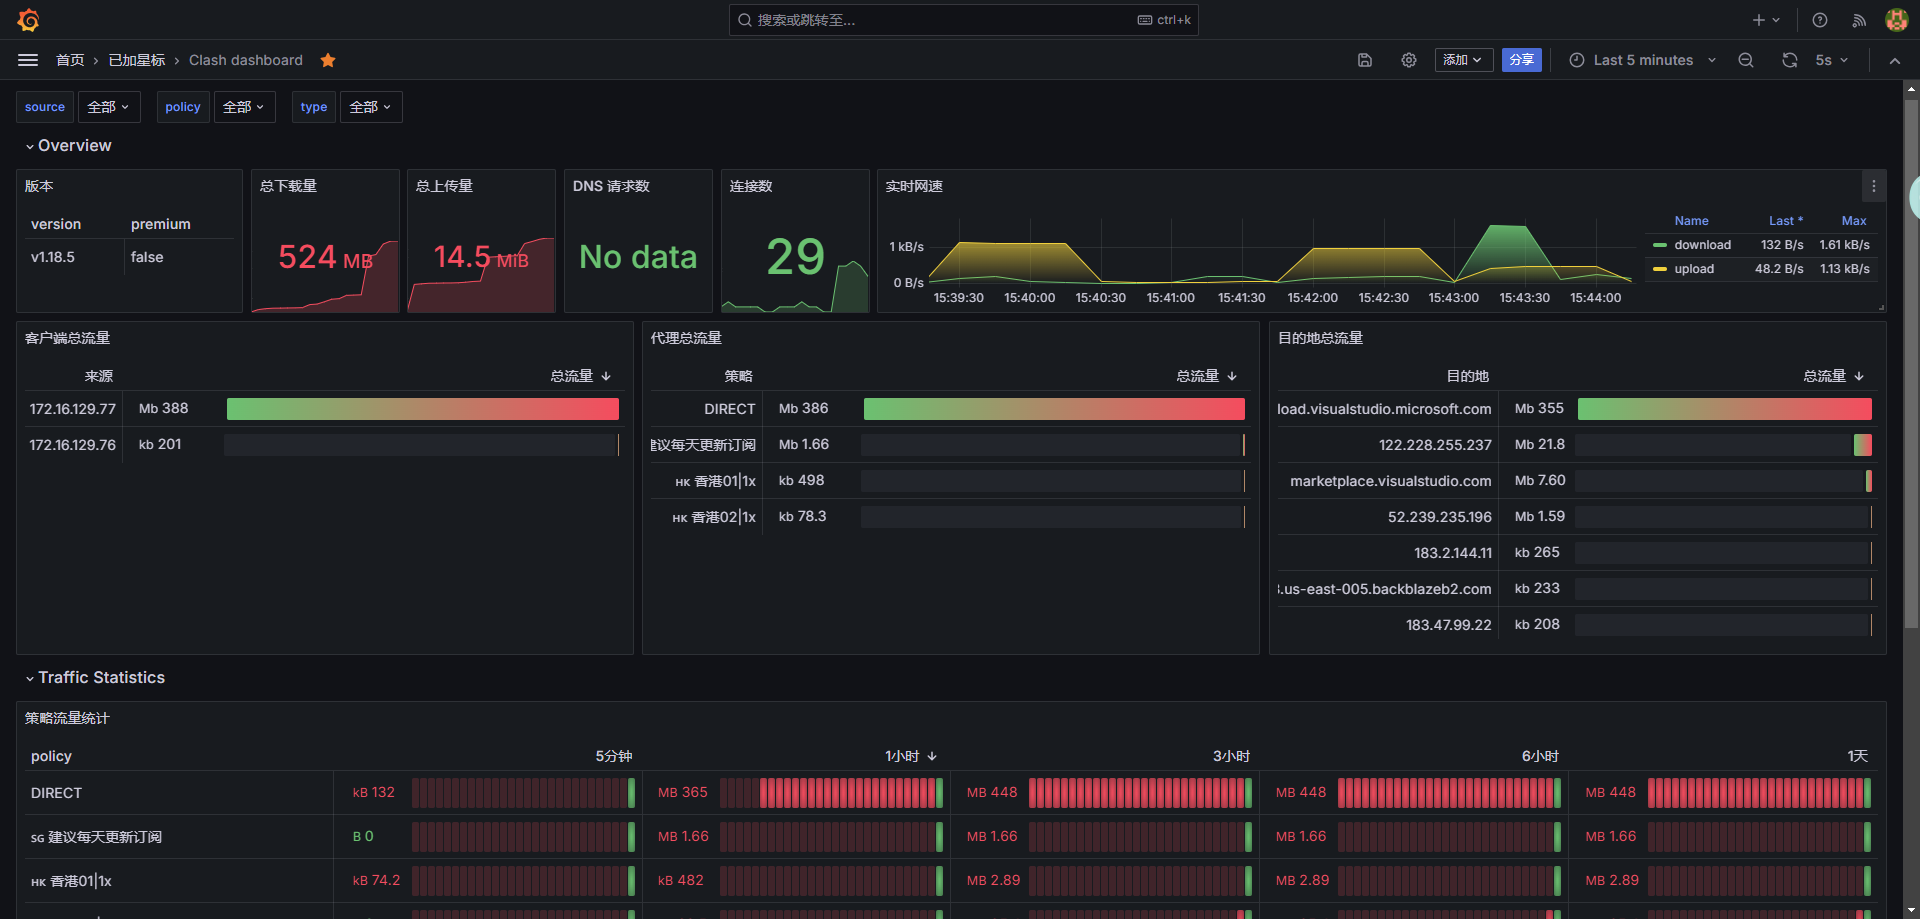
存在的问题是DNS和tracing数据为空,这个没办法,非premium核不支持
本博客所有文章除特别声明外,均采用 CC BY-NC-SA 4.0 许可协议。转载请注明来源 ciiki的博客!
相关推荐
2023-05-06
随身wifi运行ShellCrash和AdguardHome
前言上一篇文章中将随身wifi刷成了debian系统,本篇基于此为随身wifi安装ShellCrash和AdguardHome实现透明代理和广告拦截功能。(也可做为通用旁路网关的配置指南) 资源下载 UPX 官方下载:https://github.com/upx/upx/releases 下载 upx-xxx-win64.zip 文件 ShellCrash 官方下载:https://github.com/juewuy/ShellCrash/raw/master/bin/ShellCrash.tar.gz Clash.Meta 内核 官方下载:https://github.com/MetaCubeX/Clash.Meta/releases 下载 clash.meta-linux-arm64-cgo-alpha-xxx.gz 文件 AdGuardHome 官方下载:https://github.com/AdguardTeam/AdGuardHome/releases 下载 AdGuardHome_linux_arm64.tar.gz 文件 ShellCrashSh...
2023-05-14
内网穿透方案
前言简单介绍一下NAT技术,NAT全称Network Address Translation,网络地址转换,简单来说就是把内网ip转为公网ip。由于ipv4地址逐渐枯竭,ip变的十分宝贵,出现了NAT这种技术,它可以让多个设备通过NAT路由器使用同一个公网ip访问互联网,而路由器之下的这些设备之间使用内网ip进行区分。这项技术很大程度的延缓了ipv4不够用的窘境,弊端则是很难从公网去访问内网资源。目前家用宽带很少能够分到公网ip了,基本上是多户共用一个公网ip,对于有从公网访问内网的需求(比如访问家里的摄像头,nas,服务器)的人来说,那就只有做一下内网穿透了。 目前有很多成熟的内网穿透方案,比如花生壳,frp等等。花生壳付费,frp虽然免费开源,但还是需要购买一台具有公网ip的服务器作为中转服务器,一年的费用也不低,像我这种白嫖怪花钱是不可能花钱的,于是把目光定在了zerotier和cloudflare提供的tunnel上 zerotier 注册账号 https://www.zerotier.com/ ,注册完成后登录后台点击Create A Network,会生成一个带有NE...

2023-05-14
x-ui
x-ui是个小型的服务器状态面板,很多人用它来快速的配置节点,这里我只是希望用它的web界面看一下它的状态,另外用telegram接受状态通知。 首先感谢x-ui开源项目,https://github.com/FranzKafkaYu/x-ui 一键安装脚本 1bash <(curl -Ls https://raw.githubusercontent.com/vaxilu/x-ui/master/install.sh) 确认是否继续,如选择n则跳过本次端口与账户密码设定[y/n]: y 然后分别设置用户名,密码,端口 安装完成后在浏览器使用ip:端口即可进入后台 需要注意在面版设置里首次进入会随机生成面板 url 根路径,然后根据需要可以自己再改一下 telegram提醒里需要设置电报机器人Token、电报机器人ChatId、定时通知策略然后启用电报机器人,保存配置,重启面版。 当然,在首页还是关掉xray运行吧,毕竟内存不大,设置好大概就是这个样子。 telegram也可以收到通知
2023-05-06
随身wifi刷入Linux
前言介绍随身wifi原本的作用为开热点以供手机电脑等设备连接上网,工作原理和手机热点几乎一样,不过大多数随身wifi是通过焊接在其上的esim连入互联网,商家也是凭借esim月租套餐来挣钱。为了吸引顾客,有些随身wifi本身卖的很便宜,但性能并不差,可以关注酷安随身wifi话题,偶尔有随身wifi的车再叠加个红包,十元包邮就可以买下一个。本文记录基于OpenStick项目将随身wifi刷成Linux发行版debian,后续将其配置为网关服务器以及DNS服务器,同时作为小型服务器运行一些任务,踩了不少坑,写文以记录 准备工具 螺丝刀 windows系统电脑 随身wifi资源集 一颗不怕折腾的心 到手到手后大概就长这个样子,小巧但不怎么精致(小小的也很可爱呢…雾)。 用螺丝刀拆掉后面几颗螺丝,查看板子丝印,可以看到UFI003,这就是高通方案,可以刷Linux,如果是中兴微的后续就不用看了,刷不了的,具体哪些版本可以刷可以参考OpenStick的WIKI:https://www.kancloud.cn/handsomehacker/openstick/2636505 刷机安...
2024-08-08
无线网卡搭建AP
无线网卡分配IP1ip addr add 10.5.5.1/24 dev wlan0 (不一定wlan0,看你的无线网卡名称) 开启NAT和路由转发wlan0是无线网卡,eth0是连接外网的有线网卡 12345sysctl -w net.ipv4.ip_forward=1iptables -A FORWARD -i wlan0 -o eth0 -s 10.5.5.0/24 -m state --state NEW -j ACCEPTiptables -A FORWARD -m state --state ESTABLISHED,RELATED -j ACCEPTiptables -t nat -A POSTROUTING -o wlan0 -j MASQUERADE hostapd建立热点1apt install hostapd 1vim /etc/hostapd/hostapd.conf 12345678driver=nl80211ssid=37lab #自己给wifi起个名字channel=10interface=wlan0wpa=3wpa_passphr...

2024-10-14
内存重叠问题
今天开发中偶遇一个问题,程序乱崩溃,偶尔崩在new对象里,偶尔崩在对象释放里,甚至访问局部int变量也崩过,gdb显示不出更多有用信息,最后才定位到内存重叠问题 原始代码比较复杂,简化后就是下面的模型 12char arr[9];memcpy(&arr[0], &arr[3], sizeof(char)*6); 本意是节省点内存,直接用arr指向的内存,显然这里拷贝时存在重叠部分。阅读文档才知道原来memcpy不支持内存重叠的拷贝,之前还不知道。(搜索关键词 memcpy overlap) memcpy 内存重叠会引发未定义问题,这也就是程序乱崩的原因 解决方案是换成memmove即可,或者新申请块内存,拷贝至新内存再拷回去
评论